| FY 2016 S$ million | FY 2015 S$ million | ||||||||||
| Value added from: | |||||||||||
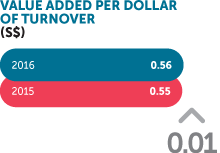
| Operating revenue | 16,961 | 17,223 | |||||||||
| Less: Purchase of goods and services | (9,639) | (9,816) | |||||||||
| 7,322 | 7,407 | ||||||||||
| Other income | 148 | 151 | |||||||||
| Interest and investment income (net) | 95 | 93 | |||||||||
| Share of results of associates (post-tax) | 2,027 | 1,735 | |||||||||
| Exceptional items | (45) | 15 | |||||||||
| 2,225 | 1,994 | ||||||||||
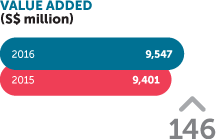
| Total value added | 9,547 | 9,401 | |||||||||
| Distribution of total value added | |||||||||||
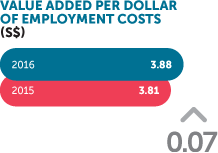
| To employees in wages, salaries and benefits | 2,457 | 2,467 | |||||||||
| To government in income and other taxes | 723 | 679 | |||||||||
| To providers of capital on: | |||||||||||
| - Interest on borrowings | 360 | 309 | |||||||||
| - Dividends to shareholders | 2,789 | 2,678 | |||||||||
| Total distribution | 6,329 | 6,133 | |||||||||
| Retained in business | |||||||||||
| Depreciation and amortisation | 2,149 | 2,161 | |||||||||
| Retained profits | 1,082 | 1,104 | |||||||||
| Non-controlling interests | (13) | 3 | |||||||||
| 3,218 | 3,268 | ||||||||||
| Total value added | 9,547 | 9,401 | |||||||||
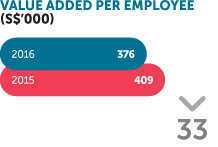
| Average number of employees | 25,423 | 22,967 | |||||||||