
Annual Report
for the year ended 31 March 2012
Management Discussion and Analysis


 Print
PrintGroup Review
|
Financial Year Ended 31 March |
|||
|
GROUP |
2012 |
2011 |
Change (%) |
|
Operating revenue |
18,825 |
18,071 |
4.2 |
|
EBITDA (1) |
5,219 |
5,119 |
1.9 |
|
EBITDA margin |
27.7% |
28.3% |
|
|
Share of associates’ pre-tax profits |
2,005 |
2,141 |
-6.4 |
|
EBITDA and share of associates’ pre-tax profits |
7,223 |
7,260 |
-0.5 |
|
Exceptional items (pre-tax) |
86 |
25 |
241.1 |
|
Taxation |
(978) |
(1,170) |
-16.4 |
|
Net profit |
3,989 |
3,825 |
4.3 |
|
Basic earnings per share (S cents) |
25.0 |
24.0 |
4.2 |
|
Underlying net profit (2) |
3,676 |
3,800 |
-3.3 |
|
Underlying earnings per share (S cents) |
23.1 |
23.9 |
-3.3 |
In this section, ‘Optus’ refers to Singtel Optus Pty Limited and its subsidiaries, ‘Singtel’ refers to the Singtel Group excluding Optus. ‘Associate’ refers to either an associate or a joint venture as defined under Singapore Financial Reporting Standards.
Notes:
(1) Effective this financial year, EBITDA refers to earnings before interest, tax, depreciation and amortisation, namely the aggregate of operating revenue and other income less operating expenses of the Singapore and Australia operations, and excludes the share of pre-tax results of associates.
(2) Underlying net profit refers to net profit before exceptional and other one-off items.
For the financial year ended 31 March 2012, the Group delivered in line with its guidance with operating revenue growth of 4.2 per cent to S$18.83 billion. The growth was underpinned by robust mobile growth in Singapore and the 4 per cent strengthening of the Australian Dollar from last year.
In Singapore, Mobile Communications recorded strong revenue growth of 7.3 per cent driven mainly by increased customer connections. As at 31 March 2012, Singtel’s mobile market share was 45.9 per cent, up 1.1 percentage points from a year ago. Data and Internet revenue was stable, reflecting planned price adjustments for Local Leased Circuits following the nationwide fibre rollout as well as continued price erosion in International Leased Circuits. Fibre rollout revenue fell 33 per cent as OpenNet Pte. Ltd. (OpenNet) reached peak rollout. Excluding fibre rollout, the Singapore Business’ operating revenue rose 3.9 per cent from last year.
In Australia, Optus recorded resilient performance in an intensely competitive market with operating revenue growth of 0.9 per cent. Mobile service revenue grew 1.0 per cent, partly reflecting the mandated decline in the mobile termination rates from 9 cents to 6 cents per minute from January 2012. Revenue from Business and Wholesale Fixed increased 3.1 per cent driven by double-digit growth in both satellite and ICT and managed services, partially offset by lower voice revenues. Consumer and Small-Medium Business Fixed revenue, however, declined 5.4 per cent on lower broadband average revenue per user (ARPU) and the continued exit of resale business. Optus’ translated revenue in Singapore Dollar terms grew 5.2 per cent from the previous year with a stronger Australian Dollar.
EBITDA for the Group was up 1.9 per cent year-on-year. In Australia, EBITDA increased 1.0 per cent mainly on lower customer acquisition costs associated with the introduction of device repayment plans on high value handsets in October 2011. In Singapore Dollar terms, Optus’ EBITDA rose 5.2 per cent. The Singapore Business’ EBITDA was stable, reflecting investments in mio TV content and higher mobile customer connections.
With a significant footprint across Asia and Africa, the combined mobile customer base of the Group and its regional mobile associates reached 445 million as at 31 March 2012, an increase of 11 per cent or 43 million from a year earlier.
Telkomsel and AIS delivered higher profits driven mainly by strong data momentum. In the Philippines, Globe registered growth in mobile and broadband though overall net profit declined on higher marketing, subsidy and network costs. In South Asia, Airtel recorded higher revenue and EBITDA on robust customer additions with rollout of 3G services. Airtel Africa performed strongly, with double-digit revenue and EBITDA growth underpinned by network expansion and a growing customer base. Overall profit contributions from Airtel, however, were impacted by higher interest, depreciation and amortisation costs associated with the 3G rollout in India as well as fair value losses.
With weaker regional currencies and higher fair value losses, the Group’s share of pre-tax profits from associates declined 6.4 per cent to S$2.01 billion. Excluding the currency translation impact and the associates’ fair value adjustments, the pre-tax contributions of the associates would have increased 2.3 per cent.
The Group’s EBITDA and share of associates’ pre-tax profits were flat at S$7.22 billion.
The Group recorded an exceptional net gain of S$86 million for the financial year. This comprised mainly AIS’ pre-tax contribution of S$80 million for the March 2011 quarter following the alignment of AIS’ reporting period to the Group, a foreign exchange gain of S$28 million which arose on repayment of inter-company loans, and a one-off charge of S$24 million for Optus’ ex-gratia costs on its workforce restructuring.
The Group’s tax expense declined 16 per cent to S$978 million primarily due to the recognition of an exceptional net tax credit of S$270 million on the increase in value of assets transferred to an associate, partly offset by Airtel’s higher taxes as a result of reduction in tax holiday benefits in India.
Net profit grew 4.3 per cent to S$3.99 billion. Excluding exceptional and one-off items, the Group’s underlying net profit declined 3.3 per cent to S$3.68 billion.
The Group has successfully diversified its earnings base through its expansion and investments in overseas markets. On a proportionate basis if the associates are consolidated line-by-line, operations outside Singapore accounted for 77 per cent and 78 per cent of the Group’s proportionate revenue and proportionate EBITDA respectively.
Singapore Business
|
Financial Year Ended 31 March |
|||
|
SINGAPORE BUSINESS |
2012 |
2011 |
Change (%) |
|
Operating revenue |
|||
|
Mobile communications |
1,919 |
1,788 |
7.3 |
|
Data and Internet |
1,607 |
1,612 |
-0.3 |
|
International telephone |
501 |
511 |
-1.9 |
|
National telephone |
352 |
375 |
-6.1 |
|
Sale of equipment |
352 |
311 |
13.3 |
|
mio TV |
106 |
79 |
34.1 |
|
Others (1) |
220 |
191 |
15.5 |
|
Singapore Telco |
5,058 |
4,867 |
3.9 |
|
Revenue from NCS |
1,315 |
1,266 |
3.8 |
|
Fibre rollout |
178 |
268 |
-33.3 |
|
Information technology and engineering (IT&E) |
1,493 |
1,534 |
-2.6 |
|
Total |
6,551 |
6,401 |
2.3 |
|
(excluding Fibre rollout) |
6,372 |
6,133 |
3.9 |
|
EBITDA (excluding Group’s corporate costs) |
|||
|
Singapore Business |
2,242 |
2,253 |
-0.5 |
|
Singapore Telco |
1,974 |
1,986 |
-0.6 |
|
IT&E |
268 |
267 |
0.3 |
|
EBITDA margin |
34.2% |
35.2% |
|
Numbers in above table may not exactly add due to rounding.
Note:
(1) Include revenues from maritime & land mobile and lease of satellite transponders.
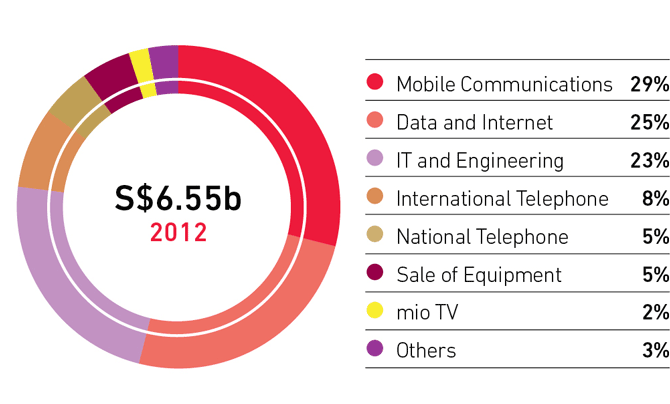
Revenue by Products and Services
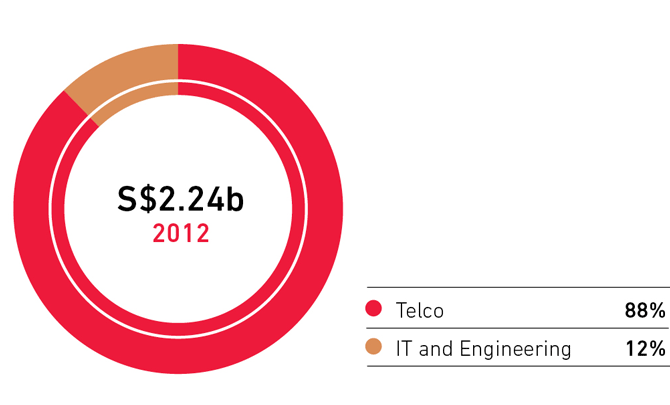
EBITDA
(Click image for larger version)
Operating revenue in Singapore grew 2.3 per cent to S$6.55 billion led by strong growth in mobile. EBITDA was stable at S$2.24 billion, reflecting investments in mio TV content and higher mobile customer connections, as well as structural separation cost payments to NetLink Trust(2).
Mobile Communications, the largest revenue stream, grew 7.3 per cent to S$1.92 billion driven mainly by strong customer connections. Total mobile customer base grew 8.3 per cent or 273,000 to 3.58 million. Singtel registered market share gains in both prepaid and postpaid, extending its lead with a mobile market share of 45.9 per cent as at 31 March 2012.
A record total number of 171,000 postpaid customers were added in the year, spurred by higher smartphone connections and strong data SIMs take-up from successful integrated mobile broadband bundles. This brought total postpaid customer base to 1.95 million as at 31 March 2012, up 9.6 per cent from a year ago. Postpaid ARPU declined S$3 but was stable excluding ‘data only’ SIMs, reflecting bundled discounts from growth in triple and quadruple play customers.
Singtel’s strong suite of smartphones and tablets combined with exclusive customised applications continued to drive growth in mobile broadband. Total number of customers on monthly mobile broadband data subscription grew 44 per cent or 386,000 from a year ago to 1.26 million as at 31 March 2012. Mobile data services accounted for 42 per cent of blended ARPU, up from 39 per cent a year ago.
In the prepaid segment, total customer base grew 6.7 per cent or 102,000 to 1.63 million as at 31 March 2012, and ARPU improved 2.8 per cent from last year. The growth was led by strong take-up for 3G, data and value added services.
Singtel continued to grow its digital presence. With exciting new offerings and exclusive sports, revenue from mio TV surpassed the S$100 million mark to reach S$106 million, an increase of 34 per cent from last year. Total mio TV customer base rose 26 per cent or 76,000 to reach 368,000 as at end March 2012. As at 31 March 2012, Singtel maintained its lead in the domestic fibre market with a fibre broadband(3) customer base of 76,000, up significantly from 14,000 a year ago.
Data and Internet revenue was stable at S$1.61 billion. Growth in Managed Services was offset by continued price erosion in International Leased Circuits and planned price adjustments in Local Leased Circuits with the nationwide fibre rollout. Fixed Broadband revenue rose 5.5 per cent on increased adoption of both fibre-based services and higher-tier plans.
IT&E revenue declined 2.6 per cent to S$1.49 billion on lower fibre rollout revenue as OpenNet achieved home coverage of over 90 per cent as of end March 2012 with completion to 95 per cent expected by June 2012. NCS strengthened its leadership in the domestic IT market with revenue up 3.8 per cent to S$1.32 billion.
International Telephone revenue declined 1.9 per cent to S$501 million on lower average collection rates partially offset by increased international call traffic.
Revenue from Fixed-line phone services decreased 6.1 per cent to S$352 million, impacted by fixed-to-mobile substitution and competition. Sale of equipment revenue grew 13 per cent to S$352 million with strong demand for smartphones and tablets.
Notes:
(2) NetLink Trust is a business trust established pursuant to regulatory requirements on structural separation under Singapore’s Next Generation Nationwide Broadband Network. It is currently 100% owned by Singtel but equity accounted as an associate in the Group as Singtel does not control it.
(3) Residential and corporate subscriptions to broadband Internet services using optical fibre networks.
Australia Business
|
Financial Year Ended 31 March |
|||
|
AUSTRALIA BUSINESS |
2012 (A$ million) |
2011 (A$ million) |
Change (%) |
|
Operating revenue by division |
|||
|
Mobile |
6,072 |
5,977 |
1.6 |
|
Fixed |
|||
|
Business and Wholesale |
2,029 |
1,967 |
3.1 |
|
Consumer and Small-Medium Business (SMB) |
1,275 |
1,348 |
-5.4 |
|
Inter-divisional |
(7) |
(8) |
-13.4 |
|
Total |
9,368 |
9,284 |
0.9 |
|
EBITDA |
2,357 |
2,334 |
1.0 |
|
EBITDA margin |
25.2% |
25.1% |
|
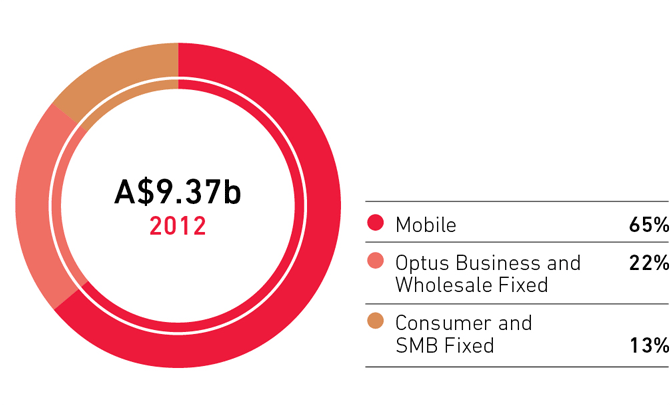
Revenue by Business Division
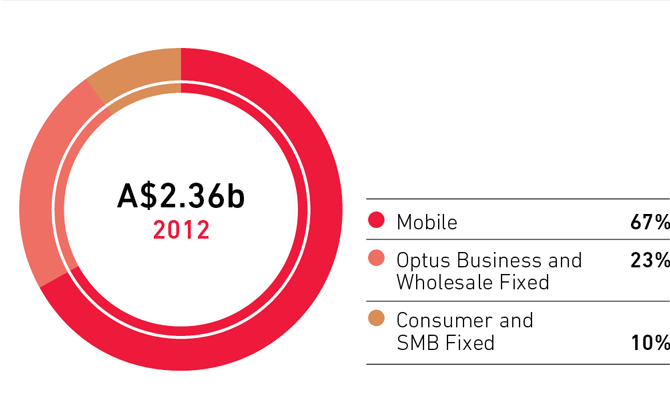
EBITDA by Business Division
(Click image for larger version)
Optus, Singtel’s largest subsidiary and Australia’s number two telecommunications operator, delivered 0.9 per cent increase in operating revenue amid intense market competition. EBITDA was up 1.0 per cent mainly from lower customer acquisition costs, reflecting the lower level of subsidies due to the introduction of device repayment plans in October 2011.
Optus Mobile contributed 65 per cent to Optus’ operating revenue and 67 per cent to Optus’ EBITDA. Mobile service revenue was up 1.0 per cent and would have increased 2.7 per cent excluding the impact of the mandated reduction in mobile termination rates and the service credits associated with the new device repayment plans.
Optus continued its postpaid customer growth momentum with net additions of 424,000 in the year, underpinned by robust demand for smartphones and wireless broadband. Reflecting its success in penetrating the wireless broadband market, the number of wireless broadband customers reached 1.58 million, up from 1.28 million a year ago. Prepaid customer base was stable at 4.29 million as at 31 March 2012.
Blended ARPU was A$45, down A$2 year-on-year due to increased mix of wireless broadband customers and higher value inclusions on selected plans. With increased data usage and higher penetration of wireless data products, SMS and other data revenue grew to 46 per cent (FY2011: 40 per cent) of ARPU while non-SMS data revenue increased to 22 per cent (FY2011: 18 per cent) of ARPU.
EBITDA grew 1.0 per cent to A$1.58 billion from lower customer acquisition costs.
Business and Wholesale Fixed accounted for 22 per cent of Optus’ operating revenue and 23 per cent of Optus’ EBITDA. Revenue grew 3.1 per cent year-on-year to A$2.03 billion. Total Business fixed revenue increased 2.2 per cent driven by ICT and managed services growth from key contract wins, while Wholesale fixed revenue expanded 4.9 per cent on strong satellite growth.
EBITDA was stable at A$546 million but would have increased 4.6 per cent excluding the write-back of a provision last year.
Consumer and Small-Medium Business Fixed contributed 13 per cent to Optus’ operating revenue and 10 per cent of Optus’ EBITDA. Consumer fixed on-net revenue declined 4.1 per cent as the growth in the on-net broadband customer base was offset by lower ARPU from increased broadband data allowances and lower telephony usage. As Optus continued to exit fixed resale services, Consumer fixed off-net revenue decreased 37 per cent, resulting in an overall decline in Consumer fixed revenue of 5.4 per cent to A$1.28 billion.
In a highly competitive fixed broadband market, Optus registered a net gain of 18,000 on-net broadband customers in the year, bringing the total customer base to 978,000 as at 31 March 2012.
With lower traffic costs from lower mobile termination rates and yield management initiatives, EBITDA improved 1.3 per cent from last year.
Associates
|
Financial Year Ended 31 March |
|||
|
ASSOCIATES |
2012 (S$ million) |
2011 (S$ million) |
Change (%) |
|
Share of ordinary pre-tax profits |
|||
|
Regional mobile associates |
|||
|
Telkomsel |
898 |
855 |
5.1 |
|
Airtel |
|||
|
- India, Bangladesh and Sri Lanka (South Asia) |
628 |
860 |
-27.0 |
|
- Africa |
(76) |
(84) |
-9.2 |
|
551 |
776 |
-29.0 |
|
|
AIS (1) |
350 |
276 |
26.9 |
|
Globe |
187 |
192 |
-2.6 |
|
Warid |
(56) |
(54) |
2.8 |
|
Pacific Bangladesh Telecom |
(28) |
(16) |
72.4 |
|
1,902 |
2,028 |
-6.2 |
|
|
Other associates |
110 |
122 |
-9.8 |
|
Group share of associates’ ordinary pre-tax profits |
2,013 |
2,150 |
-6.4 |
|
Group share of associates’ exceptional items |
(8) |
(9) |
-13.2 |
|
Group share of associates’ pre-tax profits |
2,005 |
2,141 |
-6.4 |
|
Share of post-tax profits |
|||
|
Regional mobile associates |
|||
|
Telkomsel |
665 |
638 |
4.2 |
|
Airtel |
|||
|
- India, Bangladesh and Sri Lanka (South Asia) |
474 |
726 |
-34.7 |
|
- Africa |
(117) |
(122) |
-3.9 |
|
356 |
604 |
-41.0 |
|
|
AIS (1) |
249 |
191 |
30.7 |
|
Globe |
131 |
138 |
-5.0 |
|
Warid |
(56) |
(62) |
-8.6 |
|
Pacific Bangladesh Telecom |
(29) |
(16) |
76.1 |
|
1,316 |
1,492 |
-11.8 |
|
|
Other associates |
91 |
108 |
-16.0 |
|
Group share of associates’ post-tax profits |
1,407 |
1,601 |
-12.1 |
Numbers in above table may not exactly add due to rounding.
Note:
(1) Exclude the Group’s share of AIS’ results for the March 2011 quarter following the alignment of AIS’ reporting period to the Group, recognised as exceptional items of the Group.
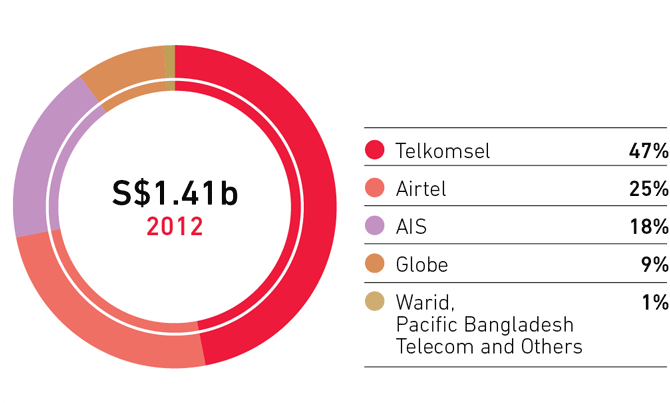
Share of Associates' Post-Tax Profits
Cash Dividends Received from Associates

(Click image for larger version)
Note:
(1) Cash dividends received from overseas associates are before withholding and other related tax payments.
For the year ended 31 March 2012, the Group’s share of the associates’ pre-tax and post-tax profits declined 6.4 per cent and 12 per cent respectively, negatively impacted by weaker regional currencies and higher fair value losses. If the regional currencies had remained stable from a year ago, the pre-tax and post-tax contributions of the associates would have declined by 1.1 per cent and 7.4 per cent respectively.
The regional mobile associates continued their strong customer growth momentum. Airtel’s total mobile customer base across 20 countries covering India, Bangladesh, Sri Lanka and across Africa, reached 241 million as at 31 March 2012, up 14 per cent from a year ago. Telkomsel registered 11 per cent growth in its customer base to 110 million as at 31 March 2012. The Group’s combined mobile customer base reached 445 million in 26 countries, a growth of 11 per cent or 43 million from a year ago.
Telkomsel accounted for 47 per cent of the Group’s share of total post-tax profits from associates, up from 40 per cent last year. Operating revenue grew 8 per cent and EBITDA increased 7 per cent driven by strong data and customer growth amid stable market conditions in Indonesia. With a 4 per cent depreciation of the Indonesian Rupiah against Singapore Dollar, Telkomsel’s post-tax contribution rose 4.2 per cent to S$665 million. Telkomsel maintained its leading position in Indonesia with approximately 43.3 per cent of market share as at 31 March 2012.
Airtel contributed 25 per cent to the Group’s share of associates’ post-tax profits, 13 percentage points lower than a year ago.In South Asia, Airtel recorded revenue growth of 12 per cent and EBITDA increase of 7 per cent, on robust customer additions with rollout of 3G services. Airtel Africa posted strong double-digit revenue and EBITDA growth underpinned by network expansion and a growing customer base. However, overall earnings were impacted by 3G network depreciation, spectrum amortisation and interest costs in India, as well as higher fair value losses. Including higher taxes from a reduction in tax holiday benefits and the steep 11 per cent depreciation of the Indian Rupee against Singapore Dollar, overall post-tax contribution from Airtel declined 41 per cent to S$356 million. Airtel continued to lead the India mobile market with a market share of 19.7 per cent as at 31 March 2012.
AIS, the leading mobile phone operator in Thailand, delivered strong operating results. Post-tax contribution surged 31 per cent to S$249 million, underpinned by strong execution, robust data growth, lower depreciation and amortisation expenses as well as lower taxes from the reduction in Thai corporate tax rate from January 2012. AIS maintained its lead in the Thailand mobile market with approximately 44.7 per cent of market share.
Globe, the second largest mobile phone operator in the Philippines, registered service revenue growth of 9 per cent driven by customer gains in mobile and broadband. With higher marketing, subsidy and network costs, Globe’s post-tax contribution declined 5 per cent to S$131 million.
In Pakistan, Warid recorded improved EBITDA with higher revenue and lower marketing costs. Including depreciation and interest costs, the Group’s share of Warid’s net loss amounted to S$56 million, down from S$62 million last year.
Cash Flow
|
Financial Year Ended 31 March |
|||
|
GROUP |
2012 (S$ million) |
2011 (S$ million) |
Change (%) |
|
Net cash inflow from operating activities |
5,710 |
6,043 |
-5.5 |
|
Net cash outflow for investing activities |
(2,809) |
(2,759) |
1.8 |
|
Net cash outflow for financing activities |
(4,264) |
(2,141) |
99.2 |
|
Net (decrease)/increase in cash balance |
(1,363) |
1,143 |
nm |
|
Exchange effects on cash balance |
(29) |
(18) |
56.5 |
|
Cash balance at beginning of year |
2,738 |
1,614 |
69.7 |
|
Cash balance at end of year |
1,346 |
2,738 |
-50.8 |
|
Free cash flow |
|||
|
Singapore |
1,170 |
1,436 |
-18.5 |
|
Australia |
1,451 |
1,519 |
-4.5 |
|
Australia (in A$) |
1,111 |
1,206 |
-7.8 |
|
Associates (net dividends after withholding tax) |
841 |
1,084 |
-22.4 |
|
Group |
3,462 |
4,038 |
-14.3 |
|
Cash capital expenditure as a percentage of operating revenue |
12% |
11% |
|
‘nm’ denotes not meaningful.
Operating Activities
The Group’s net cash inflow from operating activities for the year was S$5.71 billion, down 5.5 per cent or S$333 million due mainly to lower dividends received from the associates as well as payments of tax in Australia from this financial year. Last year, the Group received special dividends from AIS which was not repeated this year.
Investing Activities
The investing cash outflow was S$2.81 billion. During the year, payment of S$332 million was made for the acquisition of an additional 2.05 per cent equity interest in AIS. Capital expenditure totalled S$2.25 billion and represented 12 per cent of the Group’s operating revenue, 1 percentage point higher than a year ago.Major capital expenditure for the year included the expansion and enhancement of mobile networks in Singapore and Australia to support customer and data growth, investments in satellites and core infrastructure, as well as NCS’ investments in equipment for major customer contracts.
Financing Activities
Net cash outflow of S$4.26 billion for financing activities arose mainly from the payment of S$3.03 billion of final and special dividends in respect of the previous financial year ended 31 March 2011, and S$1.08 billion for interim dividends in respect of the current financial year. Other major financing cash outflows included S$922 million for settlement of swaps on repayment of bonds as well as S$415 million for interest payments. These outflows were partially offset by S$1.19 billion of cash inflow from net borrowings during the year.
Free Cash Flow
The Group’s free cash flow fell 14 per cent to S$3.46 billion. Free cash flow from Singapore declined 19 per cent from a year ago due to lower operating cash flow partly from negative working capital movements on the fibre rollout and higher capital expenditure. Free cash flow from Australia fell 7.8 per cent to A$1.11 billion but would have increased 1.9 per cent if excluding tax payments this year due to favourable working capital movements partially offset by higher capital expenditure.
Capital Management
|
Financial Year Ended 31 March |
|||
|
GROUP |
2012 |
2011 |
2010 |
|
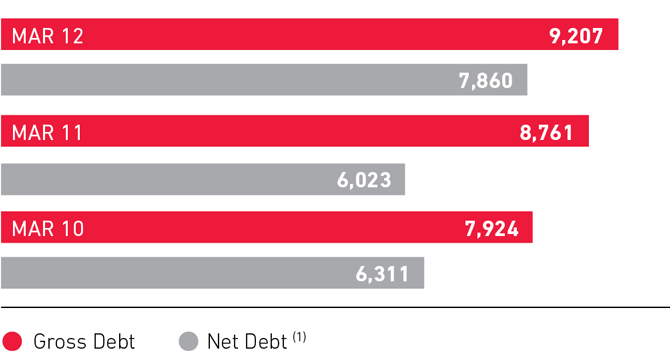
Gross debt (S$ m) |
9,207 |
8,761 |
7,924 |
|
Net debt (1) (S$ m) |
7,860 |
6,023 |
6,311 |
|
Net debt gearing ratio (2) (%) |
25.1 |
19.8 |
21.2 |
|
Net debt to EBITDA and share of associates’ pre-tax profits |
1.1 |
0.8 |
0.9 |
|
Interest cover (3) (number of times) |
20.7 |
21.8 |
23.5 |
|
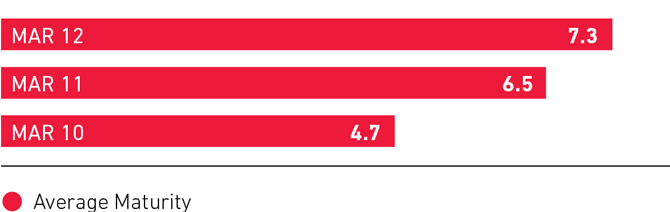
Average maturity of borrowings (years) |
7.3 |
6.5 |
4.7 |
Notes:
(1) Net debt is defined as gross debt less cash and bank balances adjusted for related hedging balances.
(2) Net debt gearing ratio is defined as the ratio of net debt to net capitalisation. Net capitalisation is the aggregate of net debt, shareholders’ funds and minority interests.
(3) Interest cover refers to the ratio of EBITDA and share of associates’ pre-tax profits to net interest expense, where net interest expense is interest expense less interest income.
Group Debt(S$m)
(Click image for larger version)
Average Maturity of Borrowings(Years)
(Click image for larger version)
During the year, the Group issued new bonds and extended its debt maturity. Net debt increased, reflecting lower cash balances after the payment of special dividends in the prior year.
The Group has one of the strongest credit ratings among telecommunications companies in Asia. Singtel is currently rated Aa2 by Moody’s and A+ by Standard & Poor’s.
Singtel’s dividend payout ratio ranges from 55 per cent to 70 per cent of underlying net profit. The Group will continue to review at least on a three-year basis its cash needs for operations and growth, with a view to returning surplus cash to shareholders. This is consistent with the Group’s commitment to an optimal capital structure and investment grade credit ratings, while maintaining financial flexibility.