Overview-
An overview of our business, providing details on how we performed, key events and achievements from the past year, as well as our strategy moving forward Our Vision and Mission
What Differentiates Us
Our StrategyFinancial Highlights
of the Year
An Exciting Year
Chairman's Statement
GCEO ReviewOur Strategy

-
- Business
Review-
Insight into each of our
business unitsGroup Consumer
A Quick Read
Singapore
Australia
Regional Mobile AssociatesGroup Enterprise
A Quick Read
Business Review
Customer Case Study: ANZ
Customer Case Study: RWS
Group Digital L!fe
A Quick Read
Business Review
Case Study: Amobee
Case Study: Singtel Innov8
-
- Sustainability
And Governance-
Information on our organisation structure, management team, corporate governance, risk management and sustainability efforts Board of Directors
Organisation Structure
Management CommitteeSenior Management
Corporate Governance
Investor RelationsRisk Management Philosophy and Approach
Sustainability
-
Performance-
Our performance at a glance Group Five-year Financial Summary
Group Value Added Statements
Management Discussion and Analysis
-
Financials- Additional
Information
Group Value Added Statements
HOME > PERFORMANCE > Group Value Added Statements 


| GROUP VALUE ADDED STATEMENTS | ||||
|---|---|---|---|---|
| 2014 S$ million |
2013 S$ million |
|||
| Value added from: | ||||
| Operating revenue | 16,848 | 18,183 | ||
| Less: Purchase of goods and services | (9,515) | (10,753) | ||
| 7,333 | 7,430 | |||
| Other income | 108 | 117 | ||
| Interest and investment income (net) | 125 | 47 | ||
| Share of results of associates (post-tax) | 1,393 | 1,397 | ||
| Exceptional items | 114 | (40) | ||
| 1,739 | 1,521 | |||
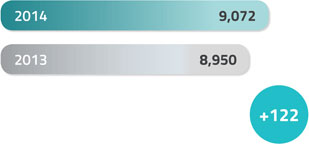
| Total value added | 9,072 | 8,950 | ||
| Distribution of total value added | ||||
| To employees in wages, salaries and benefits | 2,285 | 2,347 | ||
| To government in income and other taxes | 691 | 621 | ||
| To providers of capital on: | ||||
| - Interest on borrowings | 306 | 345 | ||
| - Dividends to shareholders | 2,678 | 2,518 | ||
| Total distribution | 5,960 | 5,830 | ||
| Retained in business | ||||
| Depreciation and amortisation | 2,133 | 2,127 | ||
| Retained profits | 974 | 991 | ||
| Non-controlling interests | 5 | 2 | ||
| 3,112 | 3,120 | |||
| Total value added | 9,072 | 8,950 | ||
| Average number of employees | 21,830 | 22,191 | ||
Productivity Data
VALUE ADDED
(S$M)
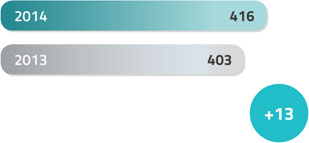
VALUE ADDED PER EMPLOYEE
(S$'000)
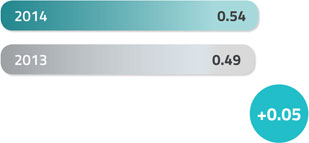
VALUE ADDED PER DOLLAR
OF EMPLOYMENT COSTS
(S$)
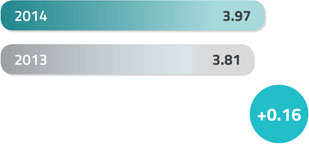
VALUE ADDED PER DOLLAR
OF TURNOVER
(S$)