Operating Revenue (1)
2017
S$16,711M
2016
S$16,961M
-1.5%
EBITDA
2017
S$4,998M
2016
S$5,013M
Stable
Net Profit
2017
S$3,853M
2016
S$3,871M
Stable
Underlying Net Profit
2017
S$3,915M
2016
S$3,805M
+2.9%
Free Cash Flow
2017
S$3,054M
2016
S$2,718M
+12.4%
Shareholder Payout
2017
S$2,857M
2016
S$2,789M
+2.4%
Return On Equity
2017
14.5% (2)
2016
15.6%
-1.1
percentage
points
Return On Invested Capital
2017
11.1% (2)
2016
11.7%
-0.6
percentage
points
Constant Currency
Net Profit
2017
S$3,832M
2016
S$3,871M
-1.0%
Underlyng Net Profit
2017
S$3,894M
2016
S$3,805M
+2.3%
Net Profit
Contribution by Geography


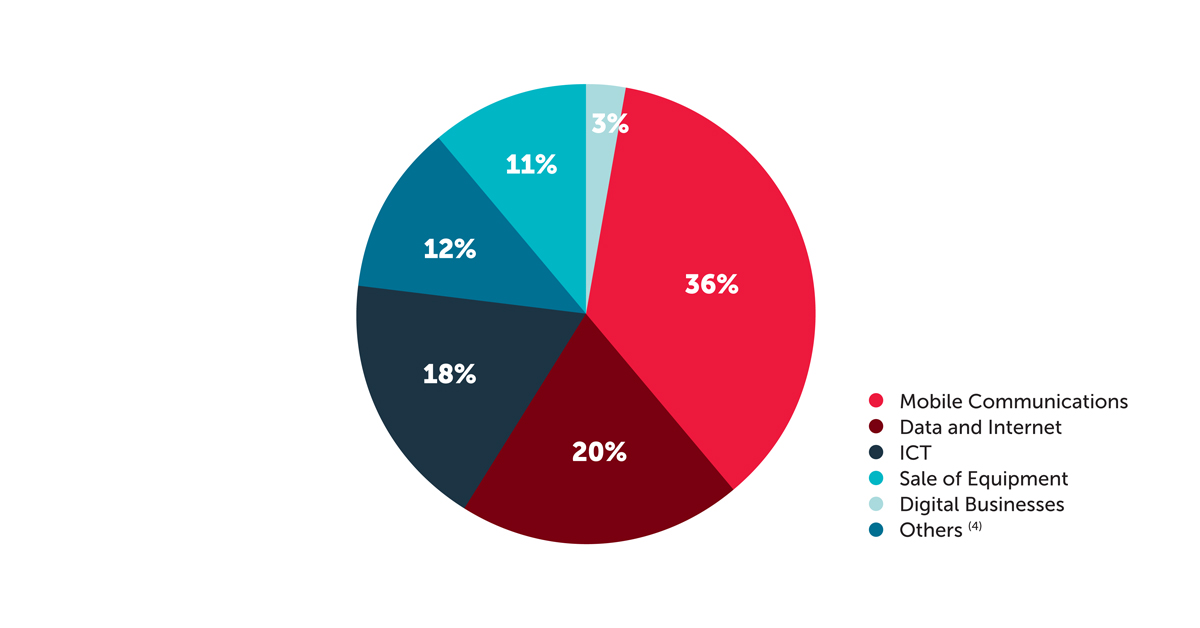
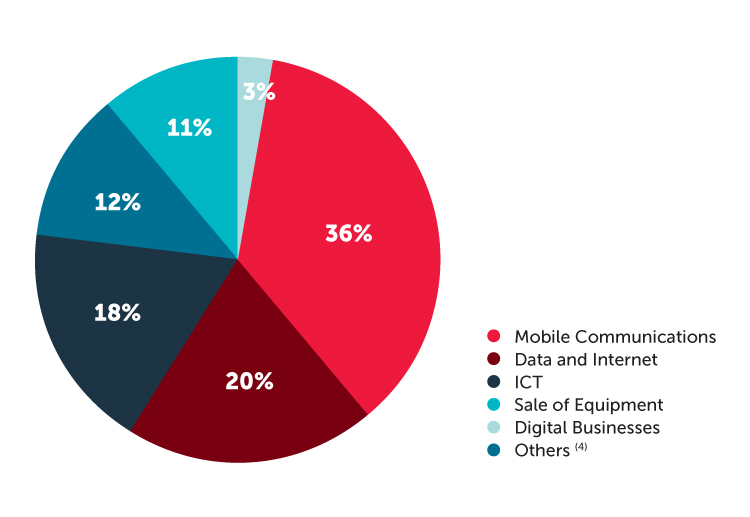
Revenue Breakdown
By products and services
Shareholder Payout
Singtel has a track record of generous shareholder returns.
We pay between 60% and 75% of underlying net profit as ordinary dividends.
For the financial year ended 31 March 2017, the Board has recommended a final ordinary dividend of 10.7 Singapore cents a share. Together with the interim dividend of 6.8 Singapore cents, the total ordinary dividends for the year is 17.5 Singapore cents, unchanged from the previous year. It also represents 73% of the Group’s underlying net profit.
Dividend per share (S¢)
2017
17.5
2016
17.5
2015
17.5
2014
16.8
2013
16.8
Notes:
(1) Impacted by regulated reduction in Australian mobile termination rates from 1 January 2016. Excluding this, operating revenue would be up 2.0%.
(2) Based on enlarged equity base, as the Group issued new shares to acquire stakes in the associates.
(3) Includes losses from Trustwave and Amobee.
(4) Includes National telephone, International telephone and Pay television.
