|
 |
| Copyright © 2013 Singtel (CRN: 199201624D). All Rights Reserved |
|
 |
|
|
| 7.3 REDUCE OUR IMPACT ON CLIMATE CHANGE AND GHG EMISSIONS |
|
| Emissions monitoring and reporting in Singapore continues to be voluntary,
but there is high interest in this area from stakeholders, including investors,
enterprises, customers and special interest groups. We will continue to monitor
local and global developments and expectations relating to greenhouse gas
(GHG) emissions. We will also periodically improve our systems to enhance
the scope of reporting so that calculations are robust and meaningful. |
| |
| Over the last three years, we have gradually expanded the scope of our
carbon footprinting calculations and in FY2013, we undertook an exercise
to estimate the impact of our employees’ commute to and from their
workplace. These figures have been included for the 1st time and this has
widened the scope of our GHG emissions calculations. |
| |
| The main source of our GHG emissions is Scope 2 electricity, purchased
directly from the national power grid in Singapore. This is our main focus
area when assessing and determining initiatives to reduce our carbon
footprint. Our net overall carbon equivalent emissions from indirect
energy are 177,296 tCO2e. Despite the energy conservation programmes undertaken in FY2013, our emissions have increased slightly by 1,698
tCO2e, about 1% from the previous year. This marginal increase is due to the
installation of more mobile base stations during the year. |
|
|
| Singtel’s Scope 1 GHG emissions are derived from a combination of
refrigerant gases used in air-conditioning systems and direct fuel use. The
Scope 1 emissions in FY2013 were 6,897 tCO2e. This is an increase of 3.9%
or 256 tCO2e over and above the total for FY2012. This increase is mainly
due to the change-out of existing R11 and R134 refrigerants. |
| |
| Following an extensive study of our employees commuting methods, our
Scope 3 GHG emissions have expanded this year with their inclusion in
the calculations. Air travel, at 2,352 tCO2e remained the biggest element of
Scope 3 emissions, but fell 712 tCO2e, or 23% in the last year. This was due
to our continued use of technology to minimise the need for business air
travel coupled with a 22% drop in long haul flights taken during the year.
The emissions figures for staff commuting added 1,821 tCO2e to the overall
calculation in FY2013. |
| |
| The full extent of aspects included in emissions calculation is shown in the table below. |
|
|
|
| |
| |
| |
Equivalent CO2 Emissions generated by Singtel[2] |
| tCO2e |
FY2010 |
FY2011 |
FY2012 |
FY2013 |
| Scope 1 (direct) |
|
|
|
|
| Refrigerant gases |
1,501 |
4,364 |
4,354 |
4,878 |
| Fuel combustion - diesel |
529 |
516 |
324 |
502 |
| Company fleet - diesel |
755 |
831 |
993 |
680 |
| Company fleet - petrol |
1,314 |
1,093 |
970 |
836 |
| Total Scope 1 emissions |
4,099 |
6,803 |
6,641 |
6,897 |
| Scope 2 (indirect) |
|
|
|
|
| Purchased electricity |
172,547 |
177,635 |
175,634 |
177,321 |
| LESS |
|
|
|
|
| Renewable energy |
(25) |
(23) |
(36) |
(25) |
| Total Scope 2 emissions (net) |
172,522 |
177,611[3] |
175,598[3] |
177,296 |
| Scope 3 (other indirect) |
|
|
|
|
| Contractor fleet - diesel |
705 |
711 |
671 |
644 |
| Contractor fleet - petrol |
115 |
134 |
132 |
97 |
| Air travel |
3,021 |
2,628 |
3,064 |
2,352 |
| Employee commute |
NA |
NA |
NA |
1,821 |
| Total Scope 3 emissions |
3,841 |
3,473 |
3,866 |
4,914 |
| Total tCO2e emissions (net) |
180,462 |
187,887 |
186,105 |
189,107 |
|
| |
| [2] |
The equivalent CO2 emissions for electricity use are calculated based on the updated simple operating margin grid emission factors from the National
Environment Agency in Singapore for the relevant time period. Scope 1 direct emissions are calculated using the 2010 Guidelines to DEFRA/DECC’s GHG
conversion factors for company reporting (Annex 1 and 5). Scope 3 other indirect emissions are calculated using the 2010 Guidelines to conversion factors
for DEFRA/DECC’s GHG company reporting (Annex 6 and 7). |
|
| |
| [3] |
Amendment to Scope 2 net emissions: FY2011 – 177,611 tCO2e (previously reported 177,570 tCO2e) and FY2012 – 175,598 tCO2e
(previously reported 175,324 tCO2e) due to an exclusion of one premise in FY2012. |
|
| |
| Staff commute study |
| In an effort to provide a more comprehensive overview of our carbon
footprint, we surveyed our employees based in Singapore for the 1st time in
FY2013 to obtain information about their commuting habits and patterns. |
| |
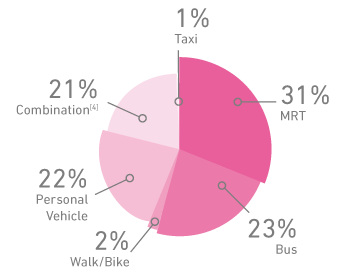
| A good response rate of about 40% was achieved with over 4,600 qualified responses. We then extrapolated the results to get a representative carbon emission
figure from Singtel’s employee commute. |
| |
| Although employee commute emissions of 1,821 tCO2e
represent less than 1% of our total carbon emissions, it contributes to
almost 40% of our Scope 3 emissions. |
| |
| This exercise will help us identify suitable initiatives to manage our Scope
3 emissions and allow us to engage our people on environmental and
sustainability issues. |
| |
| Moving forward, we will update our employee commute carbon emission figure only when
there is a significant change in our company's operations. |
| |
| |
|
|
Employee Commute
Modes of Transportation |
| |
 |
| |
| [4] Combination represents a mix of transportation modes. |
|
|
|
|
|
| |
|
|
|